
Grafana Loki
Security Information and Event Mgmt. (SIEM)
Alternative Vendors


Commercial Alternatives


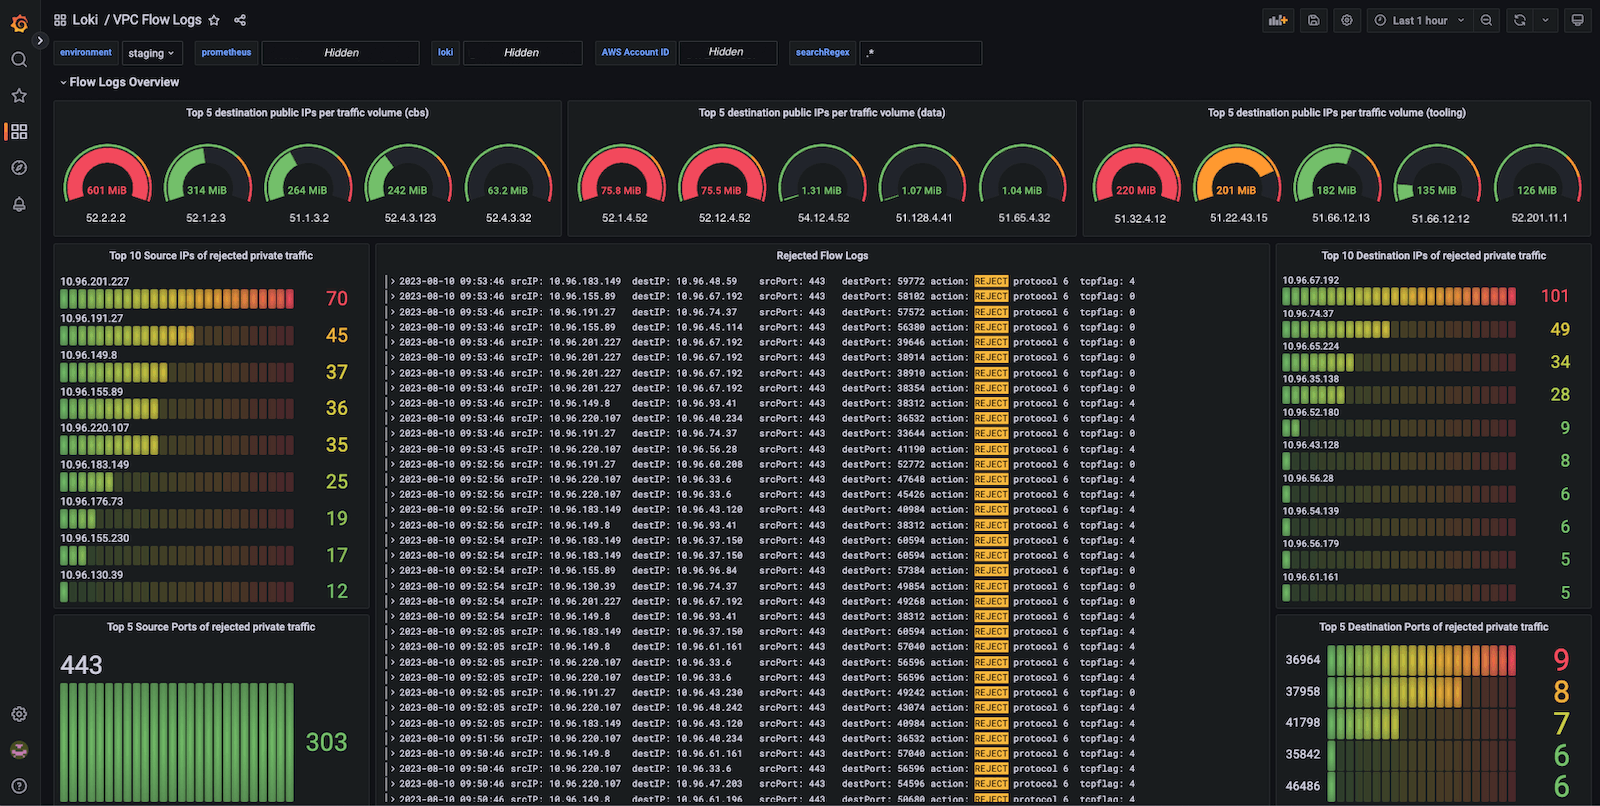
Key Features
Label-Based Indexing
Indexes only labels, not log content, which keeps the index small and storage cheap
Object Storage Backend
Stores compressed chunks in S3, GCS, Azure Blob or compatible storage for long retention
LogQL
Query language for filtering logs and turning them into metrics, inspired by PromQL
Native Multi-Tenancy
Separates data per tenant ID, with per-tenant limits and retention
Grafana Integration
Explore logs next to metrics and traces in Grafana dashboards
Flexible Collection
Ingest with Grafana Alloy, OpenTelemetry, Fluent Bit, Fluentd, Vector and more
Pros and Cons
Pros
Low storage cost
Label-only indexing and object storage keep costs well below full-text log platforms
Built-in multi-tenancy
Tenant IDs separate client data in one cluster, useful for MSPs
Open source (AGPLv3)
Free to self-host with all core features
Fits the Grafana stack
Works naturally with Prometheus, Mimir, Tempo and Grafana dashboards
Managed option
Grafana Cloud offers hosted Loki with a free tier
Cons
Label design matters
Too many or high-cardinality labels hurt performance and cost; good labels need planning
Weak full-text search
Searching content across large time ranges without label filters is slow
Not a SIEM
No built-in security detections, correlation or case management
Operational complexity at scale
Distributed mode has many components to tune and run
Feature Comparison
Comments
No reviews yet. Be the first to share your experience with Grafana Loki.
Frequently Asked Questions
/vendor/grafana-loki