
Cacti
Network Management and Monitoring
Alternative Vendors


Commercial Alternatives


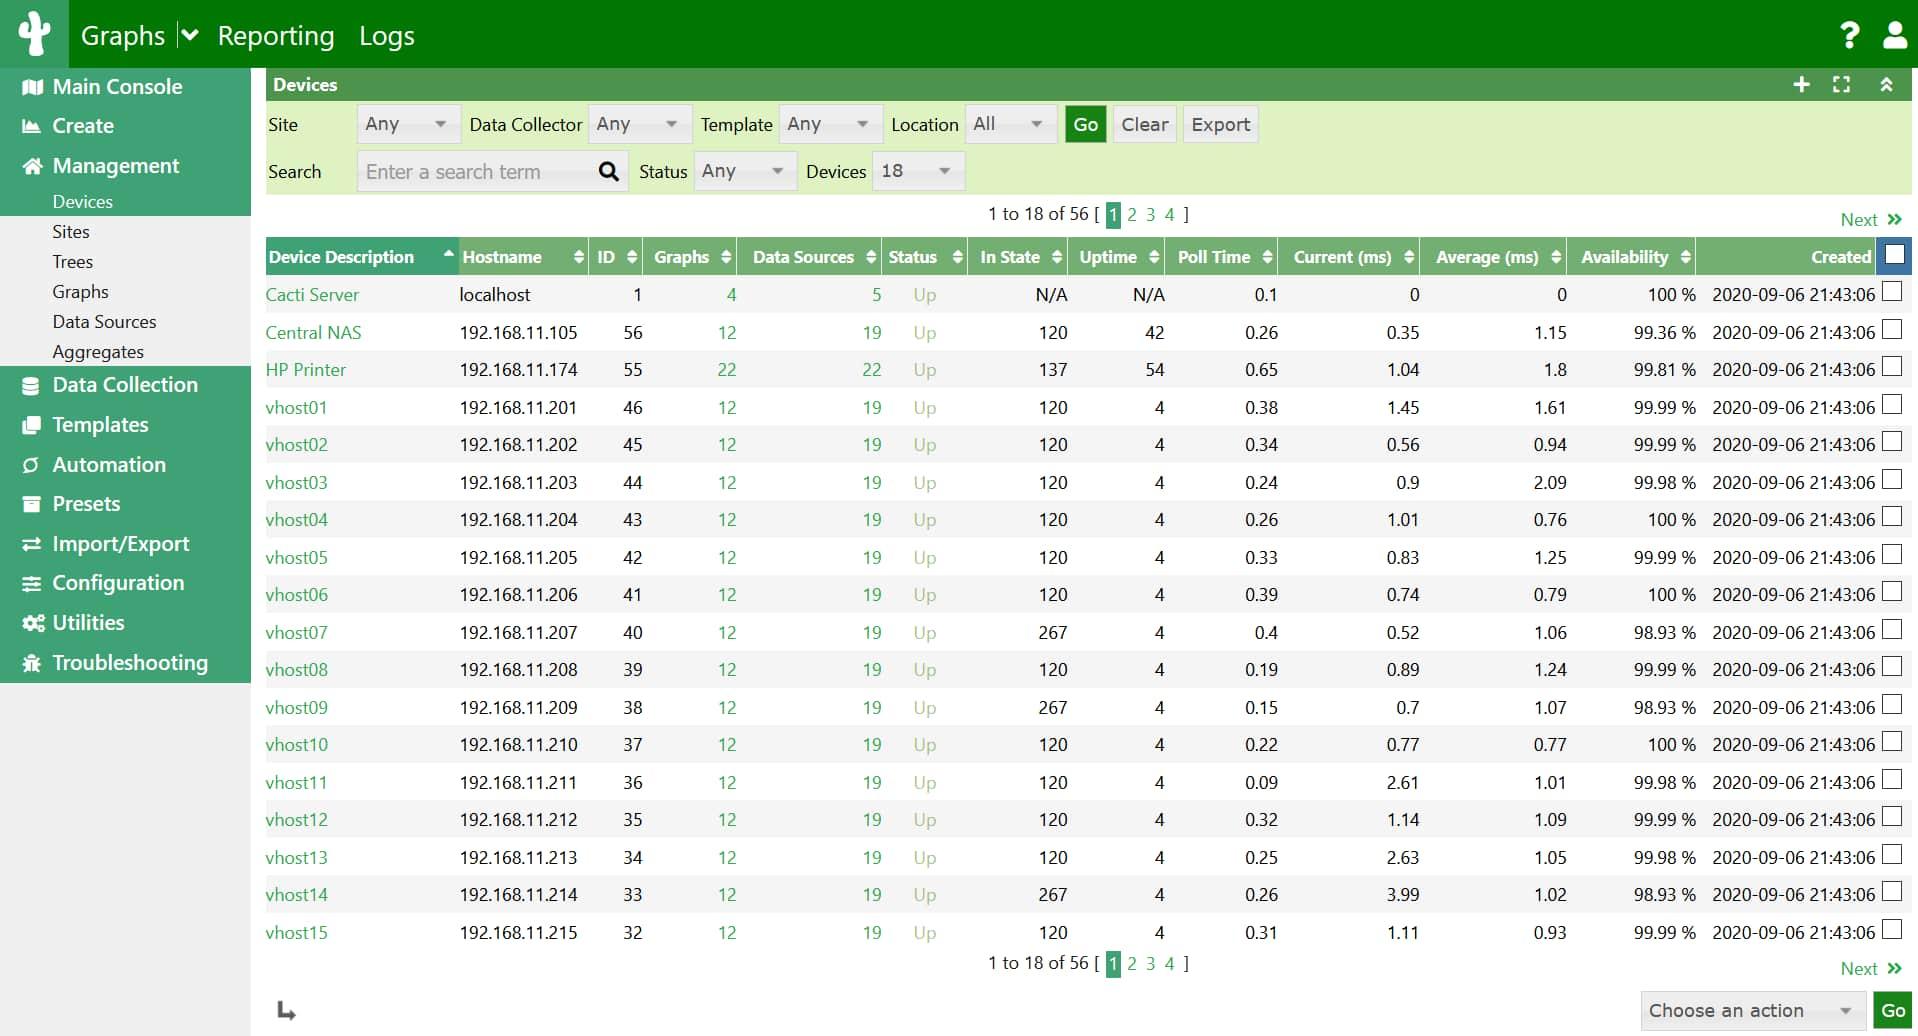
Key Features
Advanced Graphing Engine
Built on RRDTool for time-series data storage and graphing, providing detailed performance graphs with customizable visualization options and historical data retention.
Distributed Data Collection
Remote data collectors allow distributed monitoring across multiple sites with offline caching support and resilient network failure handling.
Flexible Data Collection
SNMP, ICMP, TCP, UDP monitoring with custom script support, multi-dimensional data queries, and automated device discovery capabilities.
Plugin Architecture
Extend Cacti through official plugins such as THold for threshold alerting, Syslog, Monitor and Weathermap
Extensive Device Support
Built-in templates for generic SNMP devices, Net-SNMP hosts, Windows and Cisco equipment, plus community-contributed templates
User and Graph Permissions
Control which devices, graph trees and graphs each user or group can see
Pros and Cons
Pros
Highly Customizable
Can graph any SNMP OID or script output with custom templates and data queries
Free and Open Source
No licensing costs with full source code access, backed by active community development since 2001
Proven Reliability
Long used by ISPs and network operations teams for bandwidth and performance graphing
Comprehensive Documentation
Documentation at docs.cacti.net plus forums and two decades of community knowledge
Remote Data Collectors
Collectors at each site feed one central server, which fits MSPs monitoring several customer networks
Cons
Steep Learning Curve
Complex configuration and setup process requiring significant time investment to master advanced features
Dated User Interface
Web interface feels outdated compared to modern monitoring solutions, lacking modern UX design principles
Time-Intensive Setup
Adding new device types or custom monitoring requires significant manual configuration and template creation
Alerting Needs Plugins
Alerting and notifications come from plugins such as THold rather than the core product
Graphing, Not Full Monitoring
Focused on performance graphs rather than service checks, ticketing integration or endpoint management
Feature Comparison
Comments
No reviews yet. Be the first to share your experience with Cacti.
Frequently Asked Questions
/vendor/cacti