
Netdata
Network Management and Monitoring
Alternative Vendors


Commercial Alternatives


Key Features
Kubernetes monitoring built-in
Native support for Kubernetes monitoring including pods, containers, services, and cluster metrics with automatic service discovery and labeling.
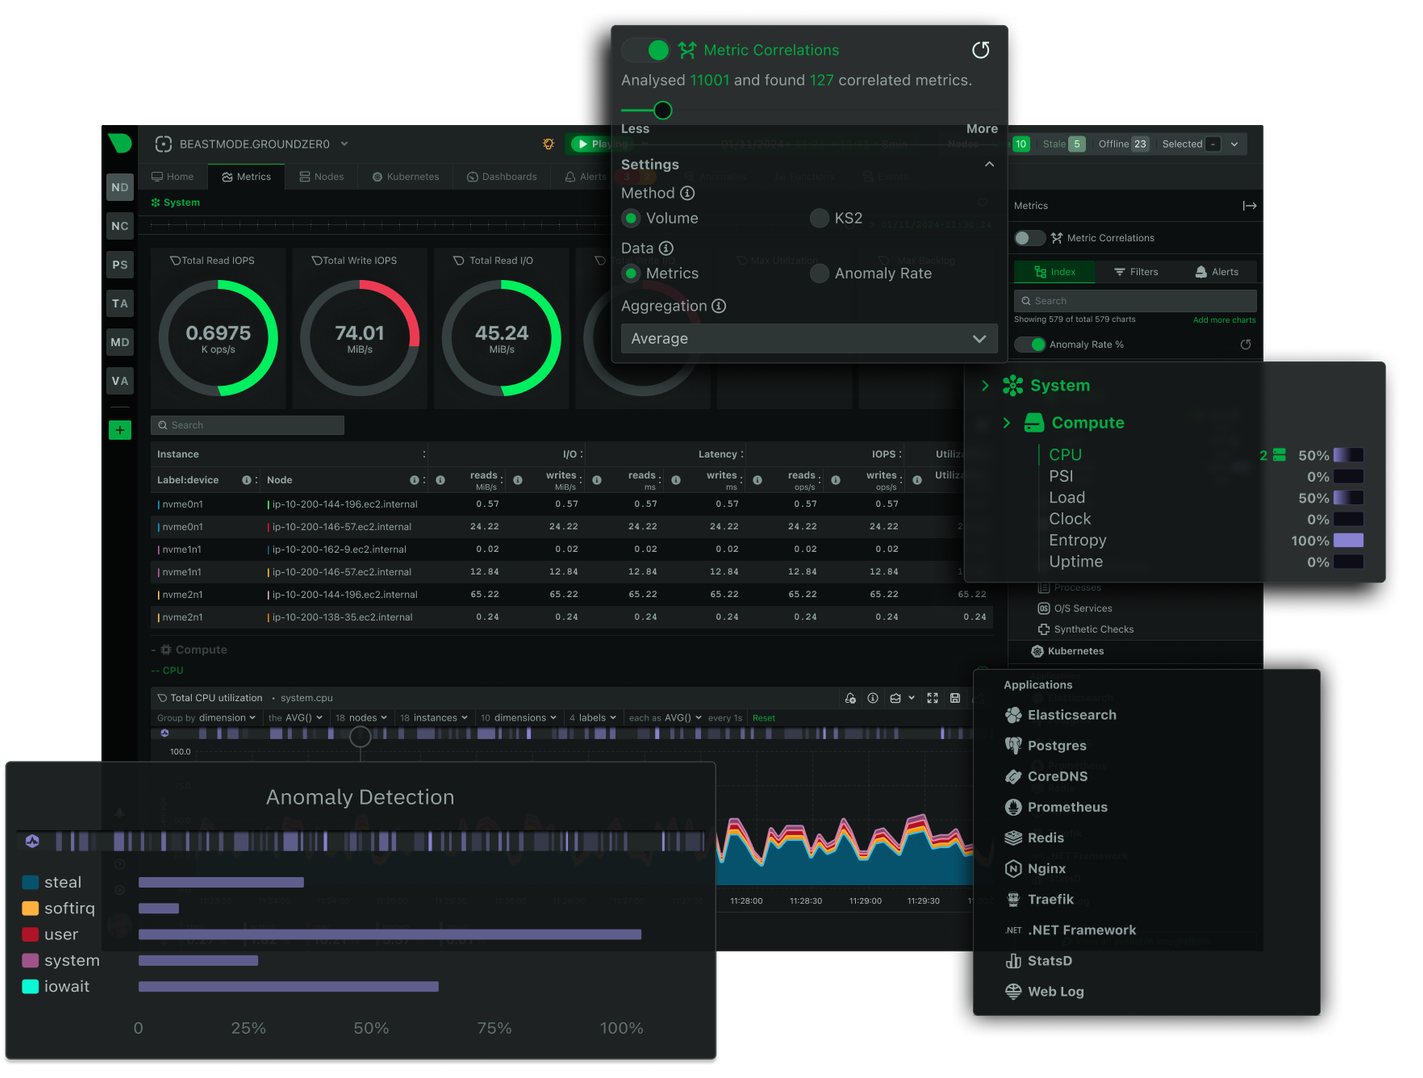
ML-powered anomaly detection
Machine learning algorithms continuously analyze metrics to detect unusual patterns, alerting on anomalies without requiring manual threshold configuration.
Real-time monitoring with per-second granularity
Collects and displays metrics every second providing unprecedented visibility into system behavior, catching brief spikes missed by traditional monitoring.
Zero configuration with auto-discovery
Automatically detects and monitors all aspects of a system including applications, containers, and databases without manual configuration.
Cloud dashboard for multiple nodes
Netdata Cloud aggregates data from many agents in one view while metric data stays on the agents and parent nodes
Custom dashboards
Build custom dashboards from any collected metrics in the Netdata dashboard and Netdata Cloud
Pros and Cons
Pros
Real-time monitoring
True real-time monitoring with per-second granularity
Lightweight agent
Extremely efficient agent with minimal resource usage
Auto-detection
Automatic detection of services and metrics
Modern interface
Interactive and responsive web interface
Open source
Free GPL-3.0 agent with active development; note that the current dashboard UI uses a separate non-open-source license
Cons
Limited historical data
Each agent keeps limited history by default; long retention needs parent nodes with more storage or a paid Netdata Cloud plan
Advanced alerting needs a paid plan
Free Community plan limits notification integrations and roles; full alerting features are in Business
Host-centric
Strongest for host and application metrics; network monitoring through SNMP is newer
Free Plan Not for Commercial Use
The free Community plan is limited to 5 nodes and personal, non-commercial use, so MSPs need the Business plan or self-hosted agents only
No MSP Multi-Tenancy
Spaces and rooms organize nodes, but there is no MSP console for managing many customers with separate billing
Feature Comparison
Comments
No reviews yet. Be the first to share your experience with Netdata.
Frequently Asked Questions
/vendor/netdata